The following text serves as a temporary placeholder, prior to expert moderation
SPECT
Moderated by: TBD
Single-Photon Emission Computed Tomography (SPECT) is a radioactivity-based imaging technique which relies on detection of gamma ray emitters which help visualize the metabolism or blood-flow changes underlying functional neuronal activation (1–4).
Technical Parameters
Similar to PET, SPECT is a radioactivity-based technique. SPECT differs from PET in that it uses gamma (single photon) emitters. Therefore, there is no information about the direction of the incoming photon, as there is with the coincidence detection in PET. To still obtain positional information, SPECT makes use of lead collimators, which guarantee that only photons from a predefined direction are accepted (2,5).
This particular characteristic has as a consequence that radiation event localization with SPECT is more challenging, generally leading to spatial resolution (> 1 cm) and especially sensitivity which is much less than that of PET (6). However, the use of single photon emitters in SPECT (see also below) has an advantage over PET as it widens the time window of observation: depending on the substance used, one would be able to detect signal hours or days after administration. Images are acquired by one or multiple gamma cameras which rotate around the region of interest in the patient and acquires images every couple of degrees. Usually, a full circle will take around 20 seconds, with full acquisition times of less than an hour.
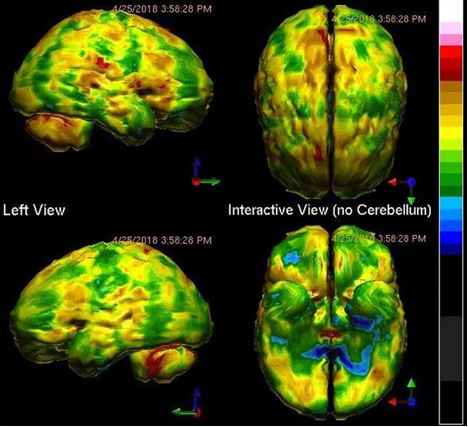
SPECT is far less ideal for quantification of signal, such as blood flow, as compared to PET. In fact, most commercial SPECT-devices do not allow such quantification, making use in a functional setting less ideal (7). Functional maps are often presented using similar color map overlays as seen in fMRI (4).
Biological Substrate
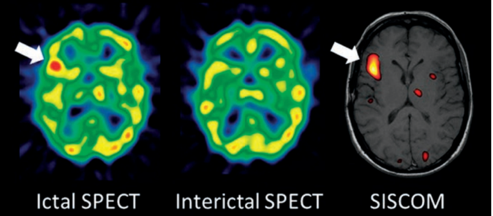
In contrast to the radiotracers used in PET, no biological single photon emitters exist to use in SPECT, meaning that non-physiological tracers will have to be used. Usually, for functional brain imaging purposes, the tracer Technetium (99mTc) exametazime (99mTc) is used (8). After injection, the lipophilic molecule passes the Blood Brain Barrier (BBB), where it rapidly converts to its hydrophilic form and remains trapped in the brain (9,10). The attachment to exametazime facilitates tracing of regional cerebral blood flow (CBF), which serves as a proxy for neuronal activation. Similar to PET, combined SPECT/CT scans are also available to allow for coregistration of images.
Intra-operative applicability
SPECT is known to be less expensive as compared to PET, which can be a great advantage in the clinical setting. However, the spatial resolution of SPECT compared to PET make it the least ideal candidate of the two (Figure 1 and 2). In fact, neither SPECT nor PET are routinely used for pre-operative surgical mapping, mostly given the more superior resolution of non-invasive techniques such as fMRI. Currently, SPECT in the clinical domain mostly seems to have a role in myocardial perfusion studies (11).
References
- Warwick JM. Imaging of brain function using SPECT. In: Metabolic Brain Disease. 2004.
- Lammertsma AA. PET/SPECT: Functional imaging beyond flow. In: Vision Research. 2001.
- Horky LL, Treves ST. PET and SPECT in brain tumors and epilepsy. Neurosurgery Clinics of North America. 2011.
- Henderson TA, van Lierop MJ, McLean M, Uszler JM, Thornton JF, Siow YH, et al. Functional Neuroimaging in Psychiatry—Aiding in Diagnosis and Guiding Treatment. What the American Psychiatric Association Does Not Know. Frontiers in Psychiatry. 2020.
- Devous MD. SPECT Functional Brain Imaging: Technical Considerations. J Neuroimaging. 1995;
- Rahmim A, Zaidi H. Pet versus spect: Strengths, limitations and challenges. Nuclear Medicine Communications. 2008.
- Meikle SR, Kench P, Kassiou M, Banati RB. Small animal SPECT and its place in the matrix of molecular imaging technologies. Physics in Medicine and Biology. 2005.
- Colloby SJ, Taylor JP, Davison CM, Lloyd JJ, Firbank MJ, McKeith IG, et al. Multivariate spatial covariance analysis of 99m Tc-exametazime SPECT images in dementia with Lewy bodies and Alzheimer’s disease: Utility in differential diagnosis. J Cereb Blood Flow Metab. 2013;
- Newberg AB, Saffer J, Farrar J, Pourdehnad M, Alavi A. Stability of cerebral blood flow measures using a split-dose technique with 99mtc-exametazime spect. Nucl Med Commun. 2005;
- Andersen AR. 99mTc-D,L-hexamethylene-propyleneamine oxime (99mTc-HMPAO): basic kinetic studies of a tracer of cerebral blood flow. Cerebrovascular and brain metabolism reviews. 1989.
- Dvorak RA, Brown RKJ, Corbett JR. Interpretation Of SPECT/CT Myocardial Perfusion Images: Common Artifacts And Quality Control Techniques. Radiographics. 2011;
- Warwick J. Brain imaging with SPECT and PET. CME. 2013;31(8).